


 10 / 72

BARBADOS PUBLIC WORKERS’ CO-OPERATIVE CREDIT UNION LIMITED
NON-CONSOLIDATED ANNUAL REPORT 2014
8
growth when compared to prior year. Loans grew by $32.5
million or 5.0 percent in 2014 as compared to prior year when
loans grew by $9.1 million or 1.4 percent.
NET INTEREST INCOME
Net interest income grew by $2.5 million or 6.1 percent in
2014. Total interest income grew by $2.8 million or 4.4 percent
while total interest expense increased by $321 thousand or
1.4 percent. Interest income increased by $2.7 million or 4.4
percent in respect of interest from loans while interest from
cash deposits and investments increased by $153 thousand or
4.1 percent during 2014.
OTHER INCOME
Other income declined by $484 thousand or 16.7 percent
during the financial year 2014 mainly due to loss of rental
income from rental of the Clarence Greenidge Building.
However, other income from value added services grew by
$199 thousand or 22.0 percent.
EFFICIENCY AND EXPENSE MANAGEMENT
The Credit Union’s strategy during the 2014 financial year
was one which focused heavily on efficiency and expense
management while at the same time adding valued customer
service. However, growth necessitated an increase in operating
expenses as we sought to recover market share thus operating
MANAGEMENT DISCUSSION AND ANALYSIS
This section of the Annual Report provides a discussion and
analysis of the financial condition and performance of the
Barbados Public Workers’ Co-operative Credit Union Limited
(BPWCCUL) for the financial year ended March 31, 2014 as
compared to the prior financial year, ended March 31, 2013.
ECONOMIC REVIEW
The global economy is still feeling the effects of the 2008-2009
recession.
Barbados’ sovereign rating was downgraded to a non-
investment grade by Moody’s and Standard & Poor’s in 2012 and
again by two notches (to Ba3 and BB- respectively) in December
2013. These actions were predicated on deteriorating growth
prospects, inadequate policies and fiscal imbalances.
In the local economy, activity is estimated to have fallen
by 0.4 percent during the first quarter of 2014. Last year
unemployment in Barbados stood at approximately 12 percent,
but this rate is forecast to rise as the government retrenchment
programme continues.
OVERVIEW
These are challenging times for the Credit Union movement as
the government has proposed that credit unions pay 0.2 percent
tax on its assets starting June 1, 2014. This is in addition to the
challenge of having more of its members being unemployed as
a result of the current retrenchment programme. However, the
Barbados Public Workers’ Co-operative Credit Union Limited
will be ever vigilant in seeking out opportunities for its members
so as to improve their social, financial and economic well-being.
During the year under review, the Credit Union continued
to grow in key aspects of its operations. New membership
averaged 333 per month and recorded net growth of 3,999
for the year ending March 31, 2014. Deposits grew by $49.4
million or 7.3 percent together with assets which grew by $49.7
million or 6.0 percent.
The Credit Union’s on-going efforts to mitigate and reduce the
level of delinquent loans have resulted in the delinquency rate
being 6.6 percent at March 31, 2014 compared to 7.7 percent
at March 31, 2013.
REVIEW OF FINANCIAL PERFORMANCE
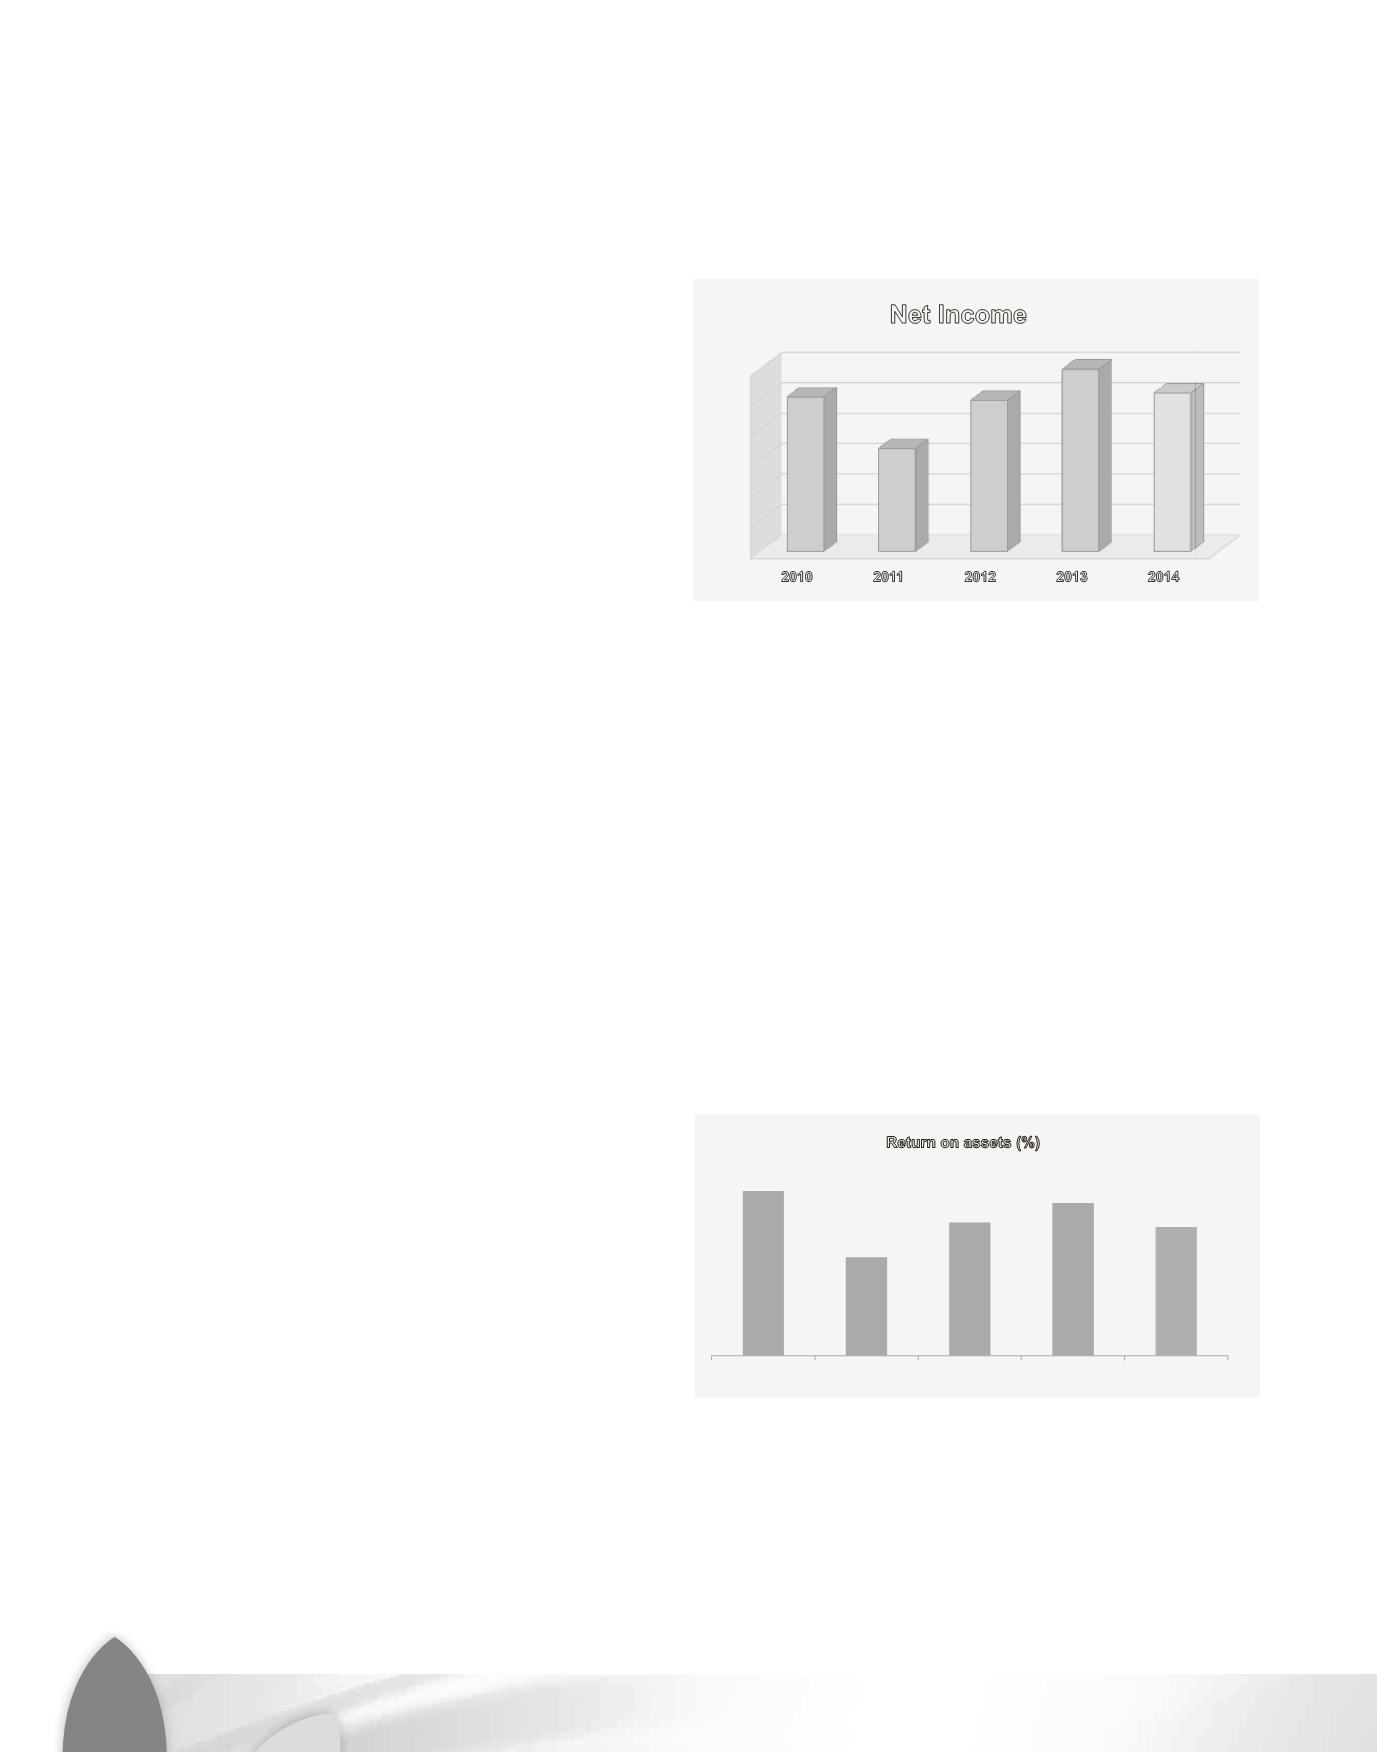
TOTAL INCOME AND NET INCOME
Net income for 2014 was $10.4 million compared to $12.0
million in the prior year. Total revenue grew by $2.4 million
in 2014 moving from $67.5 million in 2013 to $69.9 million
during the 2014 financial year.
The credit environment remained challenging in 2014.
However, the Credit Union achieved a commendable net loan
2010
2011
2012
2013
Return on assets
1.60 0.96 1.29 1.48
2010
2011
2012
2013
Return on equity
17.25 10.17 13.38 14.29
Return on equity is a key measure of profitability.
Retun on assets
It is calculated a net income expressed as a percentage
It is calculated a
of average equity
1.60
0.96
1.29
1.48
1.22
2010
2011
2012
2013
2014
Return on assets (%)
17.25
10.17
13.38
14.29
11.36
2010
2011
2012
2013
2014
Return on equity (%)
0
100
,
000
200
,
000
300
,
000
400
,
000
500
,
000
600
,
000
2010
2011
2012
2013
2014
In BD$'000
0
2
,
000
4
,
000
6
,
000
8
,
000
10
,
000
12
,
000
2010
2011
2012
2 13
2014
10
,
175
6
,
791
9
,
939
11
,
993
10
,
427
In BD$'000
Net Income